Video Overview
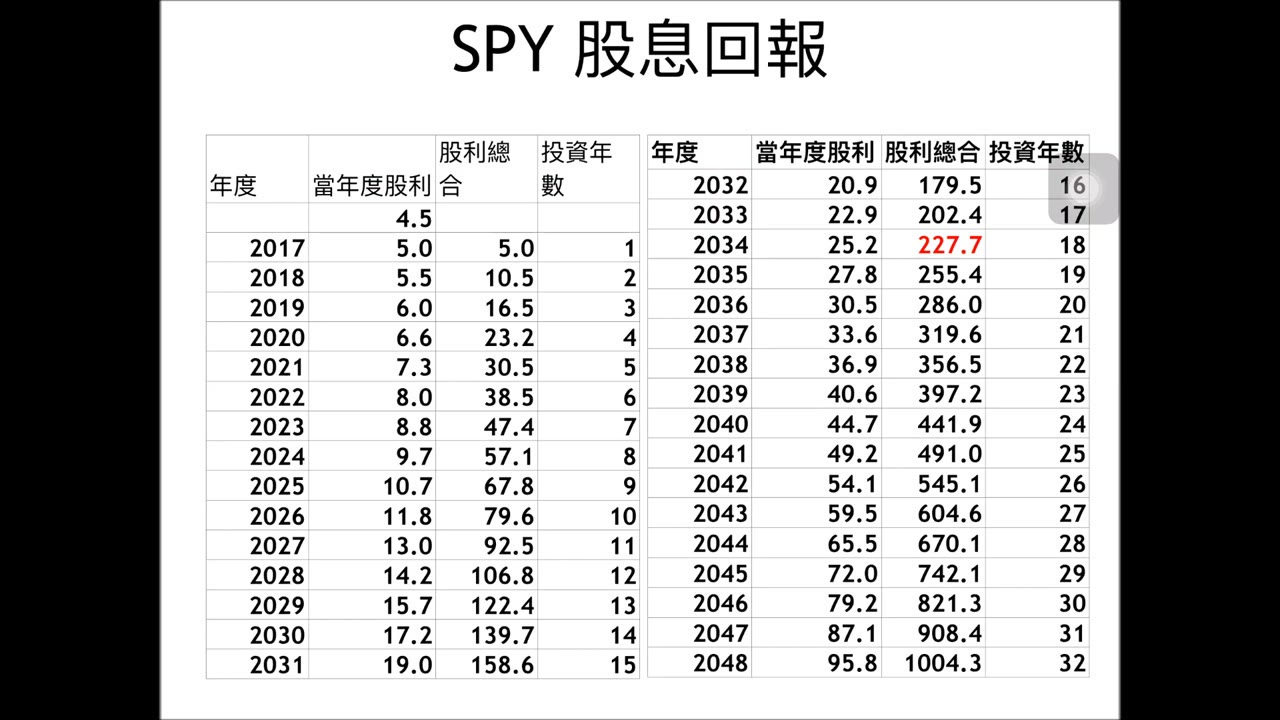
This lesson begins with long-term SPY figures to distinguish annual volatility from the broader return trend. The speaker cautions against focusing on what may happen the next day or week because short-term market moves cannot be known in advance. The second half turns to dividends, corporate growth, and historical charts comparing stocks with bonds, gold, and cash. A separate real-estate example follows, helping explain why the speaker favors stock indexes. All return figures, asset comparisons, and expectations about future growth are presented as claims drawn from the speaker's charts and commentary. They are not a performance guarantee or investment recommendation from this site.
Key Takeaways
- Citing a chart for SPY from 1950 through 2015, the speaker describes the video's long-term return estimate as 7.5% annual appreciation plus roughly 2% in dividends.
- Different annual gains are used to illustrate short-term volatility. The speaker argues for focusing on the longer-term trajectory while acknowledging that individuals cannot know the market's direction the next day or week.
- In the latter portion, the speaker links market growth to long-run human progress and rising corporate efficiency, then uses asset charts and a separate real-estate example to explain his preference for stock indexes.
Chapters
About 00:00:08 · A historical example of SPY's long-term return
The speaker opens with a SPY chart covering 1950 through 2015 and uses price changes, annualized appreciation, and dividends to describe the video's long-term market estimate.
About 00:00:56 · Short-term volatility and forecasting limits
The lesson contrasts annual fluctuations with the longer-term trajectory, emphasizing that daily or weekly moves cannot be known in advance and presenting a longer horizon as the speaker's preferred perspective.
About 00:03:03 · Growth drivers and historical asset comparisons
The speaker discusses the internet, AI, and corporate efficiency before using historical asset charts and a later, separate real-estate example to explain his perspective.
Related Topics
SPY long-term performance, US stock market volatility, long-term investing perspective, dividends and returns, historical asset comparison, stock indexes
This page was prepared with AI from selected portions of the video's audio to help readers understand the main topics. It may omit secondary material or contain transcription errors; the original video remains authoritative.