Video Overview
This course segment uses insurance, annuity, and financial-product scenarios to demonstrate how Excel's IRR function estimates the annualized return represented by cash flows. The speaker first builds a worksheet with an initial 100,000 investment followed by annual payments of 10,000 for 15 years. That arrangement is compared with cases in which 150,000 or 200,000 is received after 15 years. The exercise distinguishes the cumulative amount received from a return that accounts for timing. A web example and the speaker's account of historical index returns extend the discussion, followed by views about principal-protection claims. All figures and product comparisons are classroom assumptions or statements made in the video, not investment, insurance, or product advice from this site.
Key Takeaways
- The video presents IRR as a tool for comparing cash flows at different times, with an Excel demonstration using the complete range of payments.
- In the first example, an initial 100,000 is followed by 10,000 annually for 15 years. The speaker calculates about 4.8%, showing why 150,000 received in total is not a 50% annualized return.
- A second example returns either 150,000 or 200,000 after 15 years. The video calculates roughly 2.9% and 5%, respectively, illustrating the effect of timing.
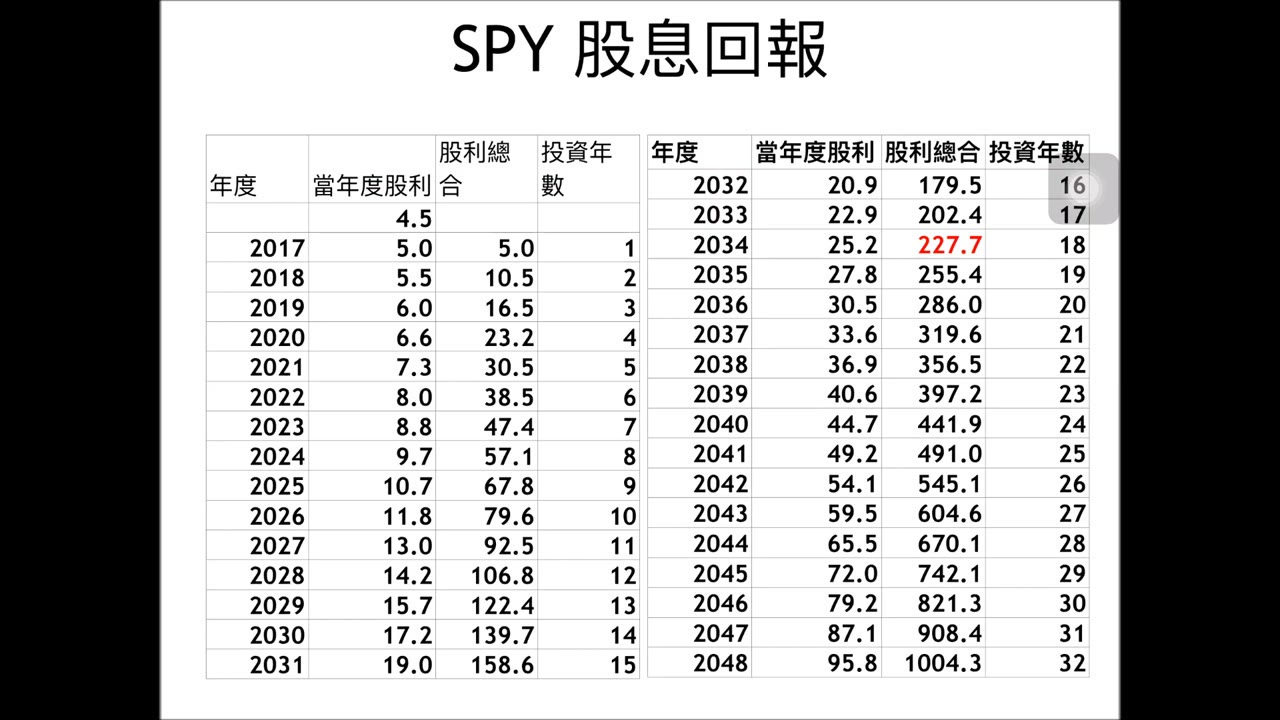
- The speaker compares historical index returns and uses a 500,000 payment with different terms and redemption values to explain IRR; the figures, product preferences, and principal-protection views are claims made in the video.
Chapters
About 00:00:25 · Understanding IRR Through Cash Flows
The speaker says product evaluation should account for when money is paid and received, then demonstrates the IRR function in Excel.
About 00:01:04 · An Annual-Payment Example
The worksheet models an initial 100,000 followed by 10,000 each year for 15 years and calculates about 4.8%.
About 00:02:40 · Comparing Lump-Sum Maturity Values
The second example sets intervening cash flows to zero and compares receiving 150,000 or 200,000 after 15 years.
About 00:04:19 · Index Comparisons and Principal Protection
The speaker compares indexes with product examples, then uses web figures to explain IRR and cautions against considering only maturity value or principal-protection wording.
Related Topics
internal rate of return, Excel IRR function, investment cash flows, annualized return, insurance and annuity evaluation, maturity value, stock index comparison, principal-protection claims
This page was prepared with AI from selected portions of the video's audio to help readers understand the main topics. It may omit secondary material or contain transcription errors; the original video remains authoritative.