Video Overview
This investment Q&A responds to recurring questions from a group of students. The opening asks why financial firms encourage stock rotation, fund switching, and profit-taking and notes that trading and cross-family subscription charges can reduce returns. A comparison of three-month and longer index charts follows, illustrating how a narrow view of volatility may obscure continuing innovation and accumulated business value. The middle section asks whether prices are already too high and whether a bubble can be identified early enough to sell. The speaker acknowledges that avoiding past market peaks involved luck and does not claim reliable foresight. A retirement example uses a multiple of annual spending to test whether assets could still support withdrawals after a severe decline. Later samples identify possible bubble or economic-stress signals, including real borrowing costs after inflation, destructive inflation, high deposit rates, and unusually easy nontraditional financing. The closing restates the holding framework, retirement margin, and limits of bubble prediction. Market direction and spending multiples are the speaker's views.
Key Takeaways
- Frequent stock or fund switching creates charges, while the revenue model of financial intermediaries may differ from the interests of a low-turnover investor.
- Short charts emphasize fluctuations, whereas longer periods reveal accumulated value from business innovation and infrastructure.
- The speaker explicitly says that market peaks cannot be identified with certainty and that successful exits in the past may have involved luck.
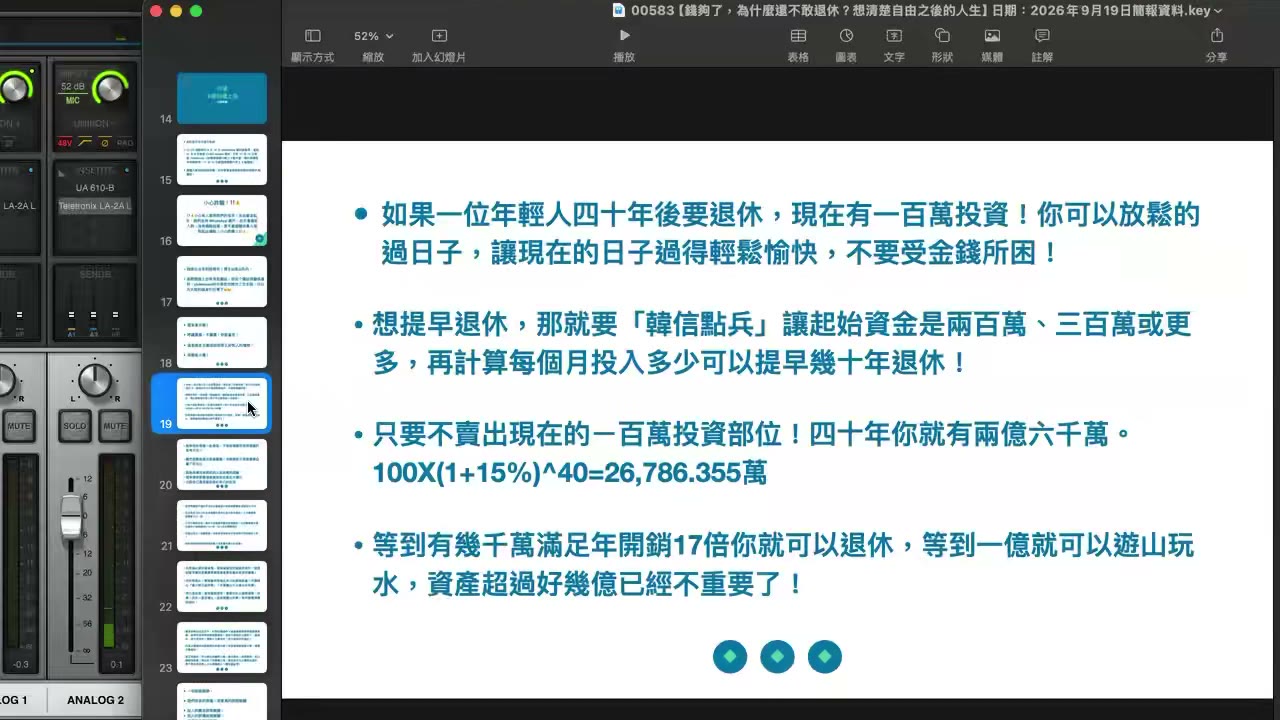
- The retirement exercise uses annual spending and an asset multiple to test the ability to withstand a deep decline rather than assuming calm markets.
- Real interest rates, severe inflation, high funding costs, and nontraditional financing are presented as indicators of bubbles or economic pressure.
Chapters
About 00:00:00 · Trading, fees, and industry incentives
The opening examines rotation and profit-taking and identifies transaction costs and financial-firm revenue incentives.
About 00:06:14 · Short-term volatility and long-term value
Short and long index charts are compared, connecting market growth with accumulated work and innovation by businesses.
About 00:11:41 · Buying now and predicting a bubble
The speaker discusses price from a long horizon and acknowledges an inability to guarantee the timing of a market top.
About 00:17:07 · Retirement assets under a market shock
An annual-spending multiple is used to examine retirement assets after a market decline and continued withdrawals.
About 00:22:33 · Real interest rates and inflation
Nominal rates are adjusted for inflation, followed by a discussion of funding costs and destructive inflation.
About 00:27:59 · Financing channels and bubble conditions
High deposit rates, easy credit, and financial innovation are presented as conditions to monitor.
About 00:34:14 · Q&A conclusions and risk boundaries
The closing summarizes holding, retirement margins, and the limitation that bubbles cannot be avoided with certainty.
Related Topics
investment turnover, transaction costs, long-term ownership, market bubbles, retirement assets, real interest rates, severe inflation, financing channels, financial innovation, risk management
This page was prepared with AI from selected portions of the video's audio to help readers understand the main topics. It may omit secondary material or contain transcription errors; the original video remains authoritative.