Video Overview
The video begins with a risk warning: short-term market drawdowns can strain an investor's finances, so capacity for loss should be understood before committing capital. It then demonstrates how to collect historical QQQ dividend and price data, align observations reported at different frequencies, and compare a dividend-growth curve with periods when price moves away from it. The speaker views rising corporate cash flows and dividends as long-run support for prices, but prices do not mechanically follow one curve and historical trends cannot guarantee future results. Hypothetical recurring-contribution examples illustrate time and compounding. The recording uses fixed-return and certainty language, which this page does not present as a promise. Later sections contrast long-term ownership with coordinated short-term trading, arguing that large groups cannot enter and exit precisely together. The conclusion extends the horizon beyond twenty years and recommends less daily market information. This is the speaker's philosophy, not a reason to ignore product, liquidity, or risk analysis.
Key Takeaways
- The opening asks investors to assess drawdown tolerance and funding stability because falling prices can create forced-sale risk as well as emotional stress.
- The video aligns QQQ dividend and price observations to compare growth and divergence; data frequency and cleaning choices affect the result.
- The speaker treats dividend growth as one clue to business value, while prices still respond to valuation, rates, constituent changes, and sentiment.
- Recurring-contribution calculations illustrate long accumulation periods, but their return rates and ending values are assumptions rather than promised outcomes.
- The speaker favors long holding periods over coordinated frequent trading and extends the horizon beyond twenty years; time does not remove product or market risk.
Chapters
About 00:00:00 · Risk disclosure and the dividend question
The opening covers losses and funding risk before introducing dividends and cash flow as possible measures of market value.
About 00:07:37 · Preparing dividend and price data
Historical quarterly price observations are selected so they can be aligned with dividend-payment frequency.
About 00:14:05 · QQQ growth curves and price divergence
The speaker compares dividend growth with price corrections and interprets the recent decline as narrowing a gap.
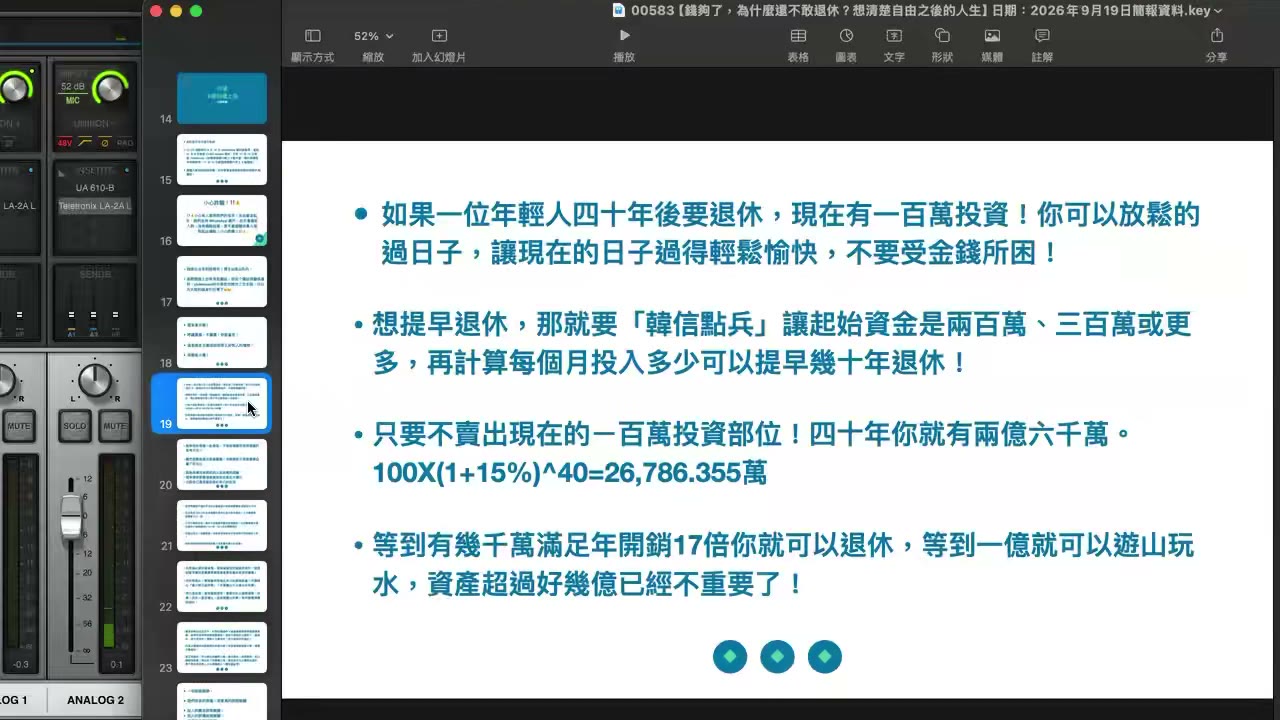
About 00:20:33 · Risk, return, and contribution assumptions
Different index preferences are discussed alongside long-run contribution calculations whose results depend on assumed returns.
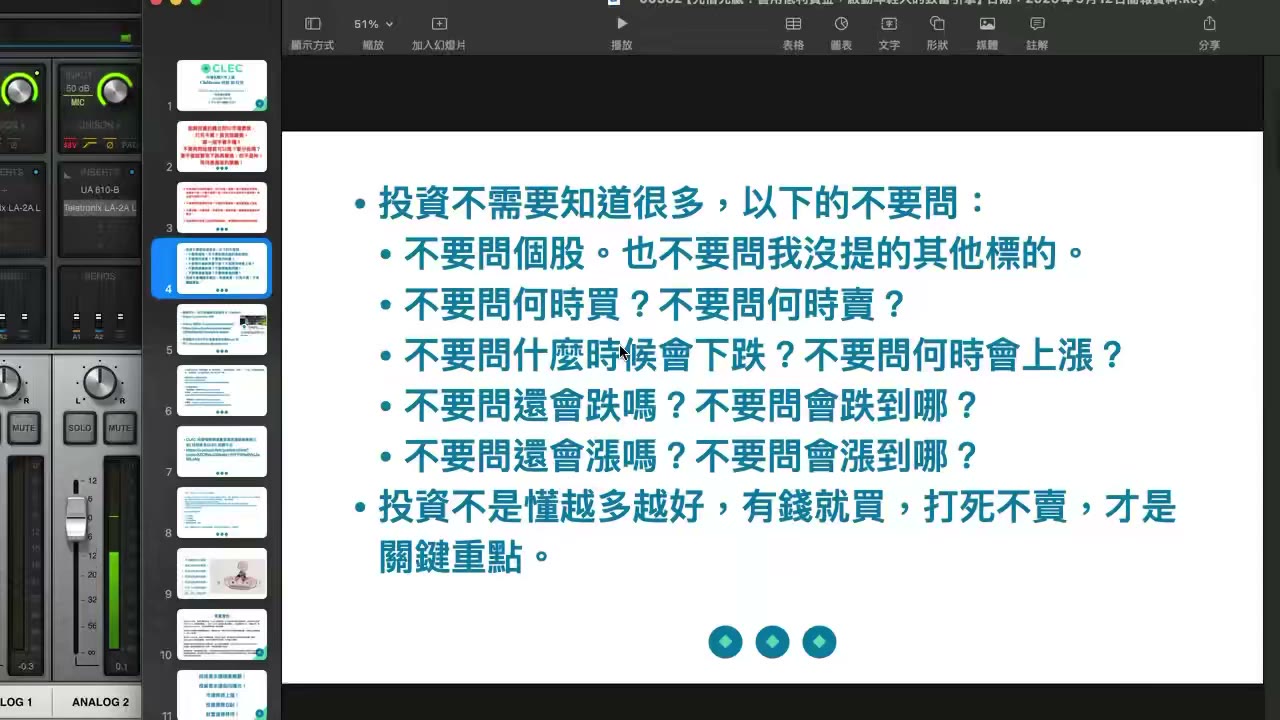
About 00:27:00 · Market cycles and trading difficulty
The speaker acknowledges corrections and bubbles, then explains the execution risks of coordinating short-term trades for a large audience.
About 00:33:28 · Lifetime horizons and product understanding
Long term is defined as more than twenty years or even a lifetime, with an emphasis on knowing oneself and the product.
About 00:41:06 · Reducing market noise and class preview
The close recommends less attention to company and macro news and previews an introductory technical-analysis class.
Related Topics
QQQ, dividend growth, historical price data, valuation divergence, market drawdowns, recurring contributions, compounding assumptions, long-term investing, short-term trading risk, investment horizon
This page was prepared with AI from selected portions of the video's audio to help readers understand the main topics. It may omit secondary material or contain transcription errors; the original video remains authoritative.